


7 Q1 Charts That Reveal the Real AI Funding Landscape
1,253 Deals, $104 B, and a Vanishing Middle

In Q1, the vast majority of AI startups quietly raised Series-A-sized tickets. I tracked 1,253 deals and mapped every dollar, tagged as Core AI or adjacent, to reveal the real Q1 funding story.1
I’m excited to share with you the real Q1 capital map in seven charts. Let’s begin by looking at the overall capital stack:
Capital Stack: Where the Money Piled Highest
Investor appetite was intense in Q1 yet sharply polarized.
Here’s how the overall numbers look:
Disclosed Deal Amounts: 1,154
Undisclosed Deals: 99
Total Deal Volume: 104.28 billion US$2
Of the 1,154 rounds with disclosed values:
83 % (956 deals) fell below $50 M,
9% (104 deals) topped $100 M—including the seven $1B+ rounds I shared in the last post.

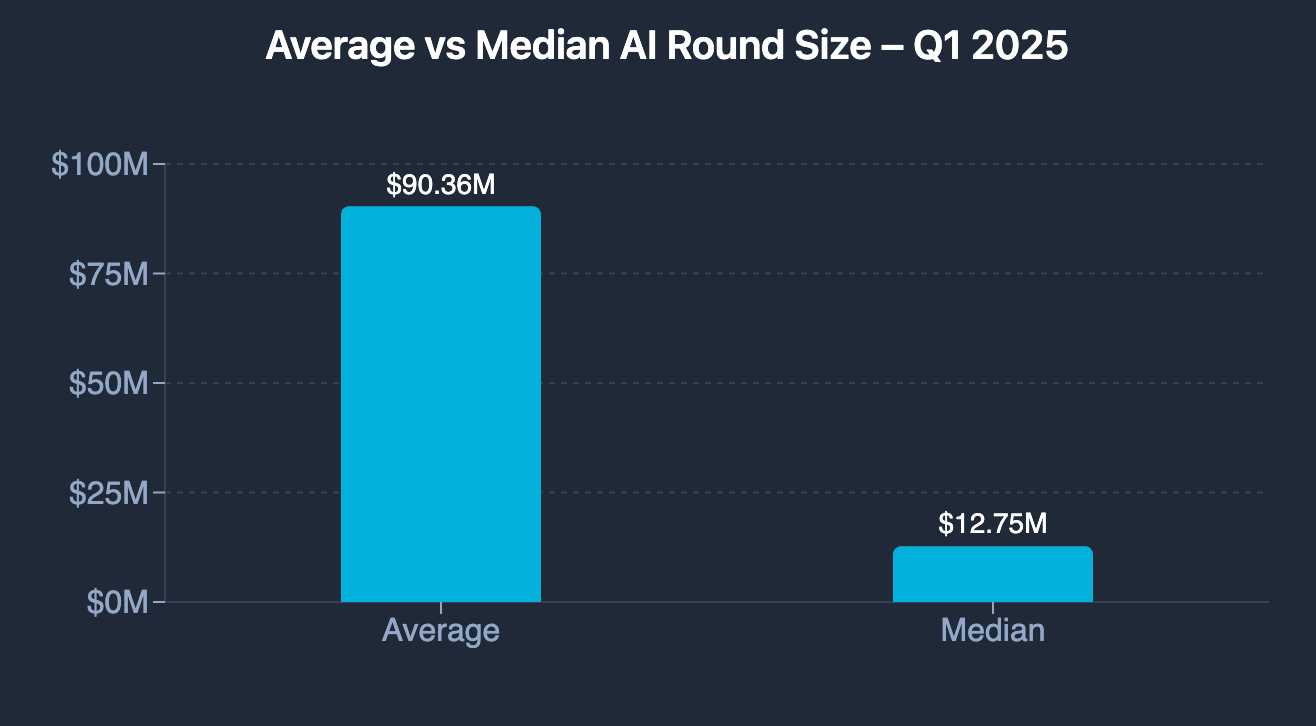
What’s striking is the gulf between the mean and median cheque:
Average: $90.36 M (inflated by mega-rounds)
Median: $12.75 M (squarely Series A-range)
Stage Velocity: Seed & A Deals Go Vertical
Early-stage momentum built steadily. Seed rounds leapt 57 % from January (82) to March (129), while Pre-Seed held flat and Series A ticked up modestly.
In contrast, at the mid-stage, Series B/C volume quietened throughout the quarter. There were a decent number of growth and strategic investments, but often not clearly tagged. For later stages, only 19 Series D and 7 Series E rounds were cleared in Q1.
Here’s a month-by-month breakdown of the funding type:

When I looked at the data for the whole quarter, interestingly, Pre-Seed (99 rounds) has fewer rounds than Series A (229).
This is indicative that many companies are probably entering the funding ecosystem directly at the Seed or Series A stages.
Indeed, Motif (Jan) and Auxia (Mar) skipped straight to combined Seed + Series A rounds. These two deals show evidence of pre-emptive capital for marquee teams.
Here’s a look at the whole quarter by funding deal type:

Geographic Concentration: 85 % of Cash Still Lands in the US
The United States towered over the rest of the world, drawing $87.3 billion, ~85% of all disclosed Q1 capital.
The United Kingdom was a distant second with 22 times lower funding at $4.0 billion (3.9 %), while a single $2 B platform raise vaulted the Cayman Islands into third place.
Here’s a look at the 10 markets:
US: $87.3 B
UK: $4.0 B
Cayman Islands: $2.0 B
Germany: $1.58 B
India: $0.97 B
Canada: $0.87 B
Israel: $0.83 B
Spain: $0.61 B
Australia: $0.60 B
Ireland: $0.53 B
A big disclaimer here is that Chinese AI rounds often exceed estimates but remain difficult to track reliably.
Here’s a bar graph showing how the countries stack up in AI capital in Q1:

Overall the geographical concentration is extreme. Eight of the ten largest markets each accounted for less than 2% of global spend.
Regionally, Europe, with funding distributed across seven countries, comes a distant second behind North America.

For investors, non-US markets remain under-capitalised relative to talent density: especially across Asia-Pacific and the EU.
Takeaways & Next Steps
Early-stage activity remains robust, and marquee teams continue to command outsized follow-on rounds. But the genuine opportunity lies in the missing middle. It’s something I've shared before, even in one of my funding dashboards.
Here’s how the deal count funnel looks:

Will Q2 widen this gap or restore balance? Would love to hear your thoughts. Oh, and I would be grateful for your feedback in the poll below too.
That’s all I have for this Q1 report. I’ll publish a market gap report—breaking down key Q1 sectors and industries—in two weeks. Subscribe to get it first.
Figures are refreshed continuously; minor variances may appear as deals are revised or re-classified.
All amounts have been converted into USD using these FX rates:
GBP → 1.33,
EUR → 1.13,
CAD → 0.72,
INR → 0.012,
KRW → 0.00070